Generate generic plots of HarvestChoice 5-arc-minute spatial indicators
Method to plot HarvestChoice rasters with mutiple layout and symbology options.
See examples below. Note that calling genPlot(...) is equivalent to calling
the convenience method hcapi(..., format="plot").
genPlot(var, iso3 = "SSA", pal = character(0), layout = "default")
Arguments
- var
- character array of variable codes to plot
- iso3
- optional ISO3 country or region code(s)
- pal
- optional Brewer color palette used for plotting, e.g. "Blues"
- layout
- one of "default" or "thumbnail" to control legend and axes
Value
raster plot
Details
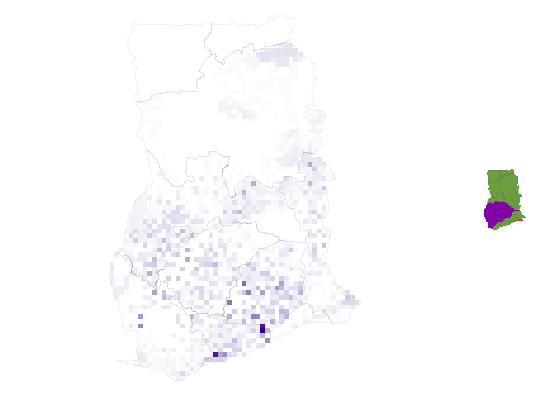
API call: generate 2 plots showing farming systems and 2012 population density for Ghana
$ curl http://hcapi.harvestchoice.org/ocpu/library/hcapi3/R/hcapi \
 -d '{"var":["FS_2012_TX", "PD12_TOT"], "iso3":"GHA", "format":"plot"}' \
 -X POST -H 'Content-Type:application/json'
--
/ocpu/tmp/x03d5aa8e98/R/.val
/ocpu/tmp/x03d5aa8e98/stdout
/ocpu/tmp/x03d5aa8e98/source
/ocpu/tmp/x03d5aa8e98/console
/ocpu/tmp/x03d5aa8e98/info
/ocpu/tmp/x03d5aa8e98/files/DESCRIPTION
/ocpu/tmp/x03d5aa8e98/graphics/1
/ocpu/tmp/x03d5aa8e98/graphics/2
GET individual plots or all generated plots in a ZIP archive
$ wget http://hcapi.harvestchoice.org/ocpu/tmp/x03d5aa8e98/graphics/1/png?width=640
$ wget http://hcapi.harvestchoice.org/ocpu/tmp/x03d5aa8e98/graphics/last/svg
$ wget http://hcapi.harvestchoice.org/ocpu/tmp/x03d5aa8e98/zip
See also
hcapi link\[classInt:classIntervals]classIntervals
Examples
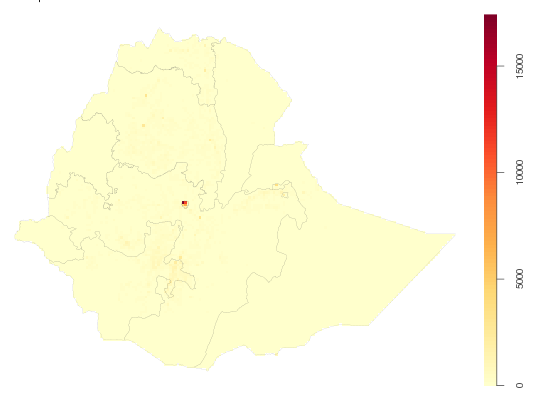
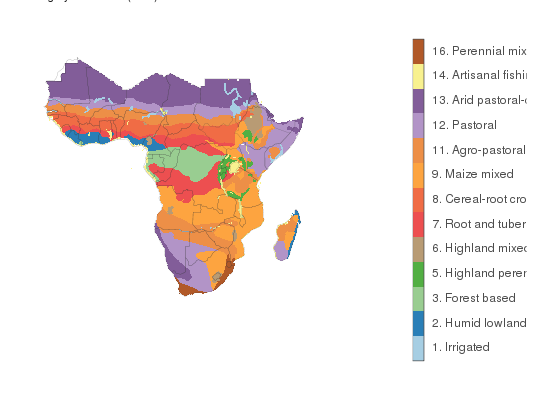
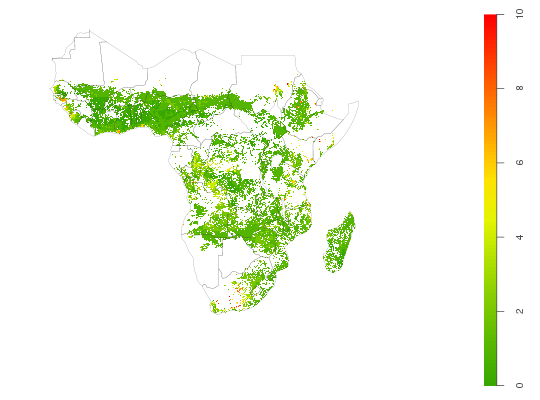
# Generate standard raster plot of 2012 population density for Ethiopia genPlot("PD12_TOT", iso3="ETH", pal="YlOrRd")#> NULL# Generate 2 raster plots for Ghana (thumbnail format with no legend) genPlot(c("AEZ16_CLAS", "cass_h"), iso3="GHA", layout="thumbnail")#> NULL#> Warning: grid has empty column/rows in dimension 1#> Warning: grid has empty column/rows in dimension 2#> NULL#> Warning: grid has empty column/rows in dimension 1#> Warning: grid has empty column/rows in dimension 2#> NULL


